At SVN Cornerstone, we are ready to help you figure out your office needs. Let’s get to know each other and work through the obstacles.
Give our office a call at 509-321-2000
Enjoy this article posted by Co-Star on the current office landscape.
Lower Pre-leasing, Higher Sublease Availability Pressure Sunbelt and Tech Markets With Lots of Office Space Underway
") With expectations for much weaker office demand in the near term because of the economic downturn, the pressure from new supply will be felt more keenly in some markets. (iStock)
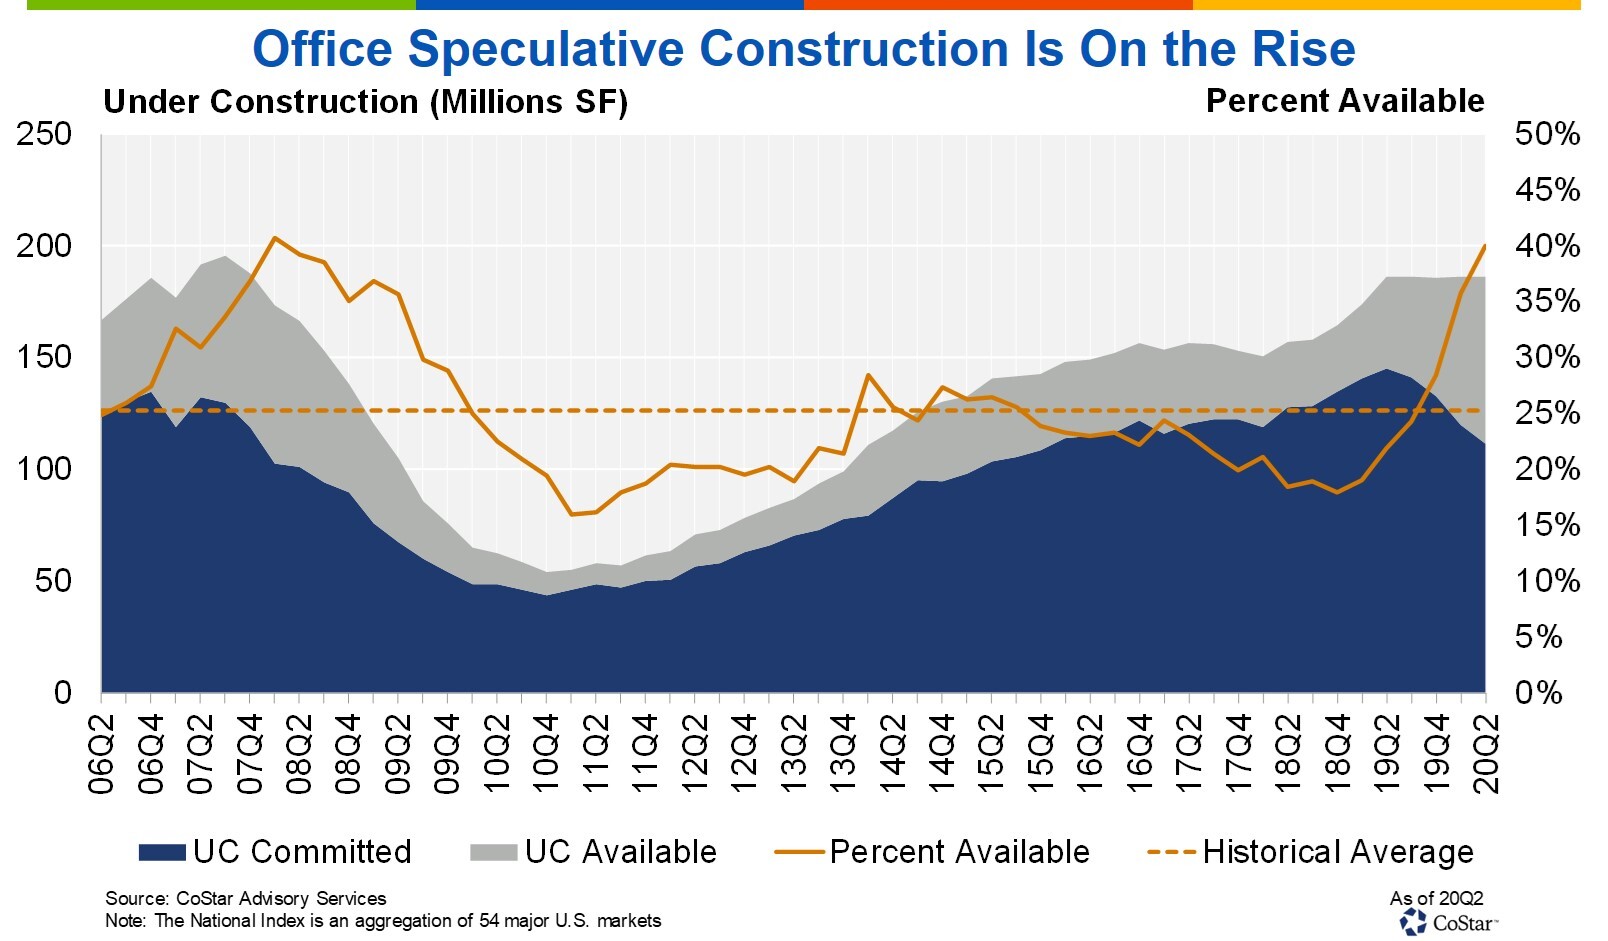
With expectations for much weaker office demand in the near term because of the economic downturn, the pressure from new supply will be felt more keenly in some markets. (iStock)Office construction activity has been more muted in this economic cycle, at least on a national level, which is why the second quarter vacancy rate only ticked up to 9.9% from 9.7% despite weaker demand. However, there is still 186 million square feet of office space under construction, or about 2% of the total office inventory across the major 54 U.S. metropolitan areas.
Just six months ago, this new supply may not have posed a significant risk to the outlook of the U.S. office market. However, given expectations for much weaker demand in the near term because of the economic downturn, the pressure from new supply in some markets will be felt more keenly.
The share of the office construction underway today without a tenant commitment has risen to cyclically high levels. Meanwhile, sublease space availability is rising in tandem in some markets, suggesting further near-term pressure on office occupancy levels in the current environment.
Office construction is peaking below the levels reached in the previous two cycles. However, the rate of preleasing has dipped dramatically. Today, 40% of the office space under construction nationally is available, a sharp upward trend from the 19% availability rate that prevailed in 2018 and matching the high point of availability during the last economic cycle in 2008.
The availability rate began rising from cyclical lows in 2019, which is not unusual in the late stages of an economic cycle. However, it has accelerated significantly in the past couple of quarters, coinciding with the plunge in leasing activity for both existing and under-construction office space caused by the pandemic. The drop in the office preleasing rate reflects the heightened caution on the part of tenants to commit to an office lease in such an uncertain economic environment.
The amount of office construction underway and the share that is available varies significantly from market to market, however, so this trend will not be felt equally. Over the past 10 years, office construction has been concentrated in the downtown areas of primary markets and select secondary markets, particularly those in the fast-growing Sunbelt. The size of the bubble in the chart below corresponds with the amount under construction as a share of a market’s inventory.
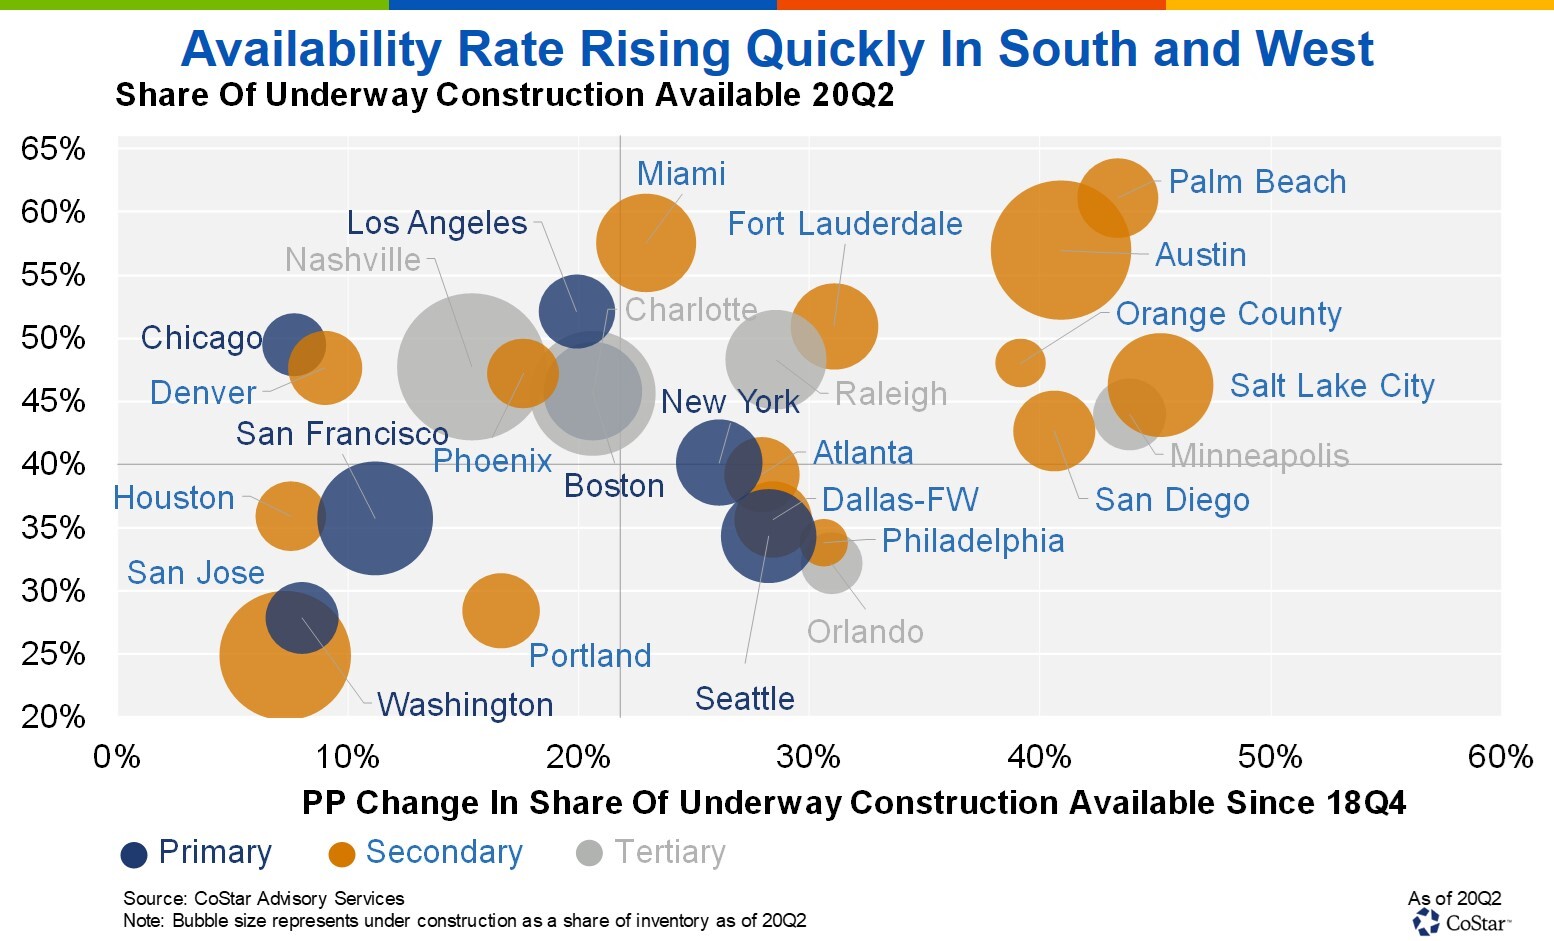
Nashville, Tennessee, and Austin, Texas, have the highest levels of office construction today, equating to 7.5% and 6.8% of inventory, respectively, as their strong employment growth has attracted development. Other secondary and tertiary markets such as San Jose, California; Charlotte, North Carolina; Salt Lake City, Utah; and Miami, Florida, as well as primary markets such as San Francisco, Seattle and Boston also are experiencing a strong influx of new supply. Of course, New York has the most office construction underway of any market at 24 million square feet. But as a share of inventory, New York’s current office construction level is only modestly above average at 2.6%.
A higher rate of construction doesn’t tell the whole story, though. What has changed recently is the amount of in-process office construction that is now available in many markets. In both Austin, Texas, and Palm Beach, Florida, for example, nearly 60% of the office space underway is available, rocketing up from 20% at the end of 2018.
Other markets with significant, and increasing, availability include Miami and Fort Lauderdale, Florida; Orange County, California; and Salt Lake City, Utah. Availability rates in Chicago and Los Angeles are relatively high as well, at over 50%, which is worth monitoring. These markets, though, typically have lower levels of preleasing relative to the national average.
The sheer size of New York’s office construction pipeline means that there is still nearly 10 million square feet underway that is uncommitted, even though preleasing is about even with the national average at 40%.
Meanwhile, other markets, including San Jose and San Francisco, have high rates of construction underway, but the availability of new office supply has remained quite low throughout the past several years. Expansion by some of the world’s largest and most profitable tech firms has driven strong preleasing in the San Francisco Bay Area, but no office market has been immune to the recent slowdown in leasing volume.
In an environment of depressed leasing activity and uncertainty among businesses about their future office space needs, especially given the large numbers of office-based employees working from home, sublease space availability has also begun to tick up and will only exacerbate the impact of speculative office developments delivering with less space preleased.
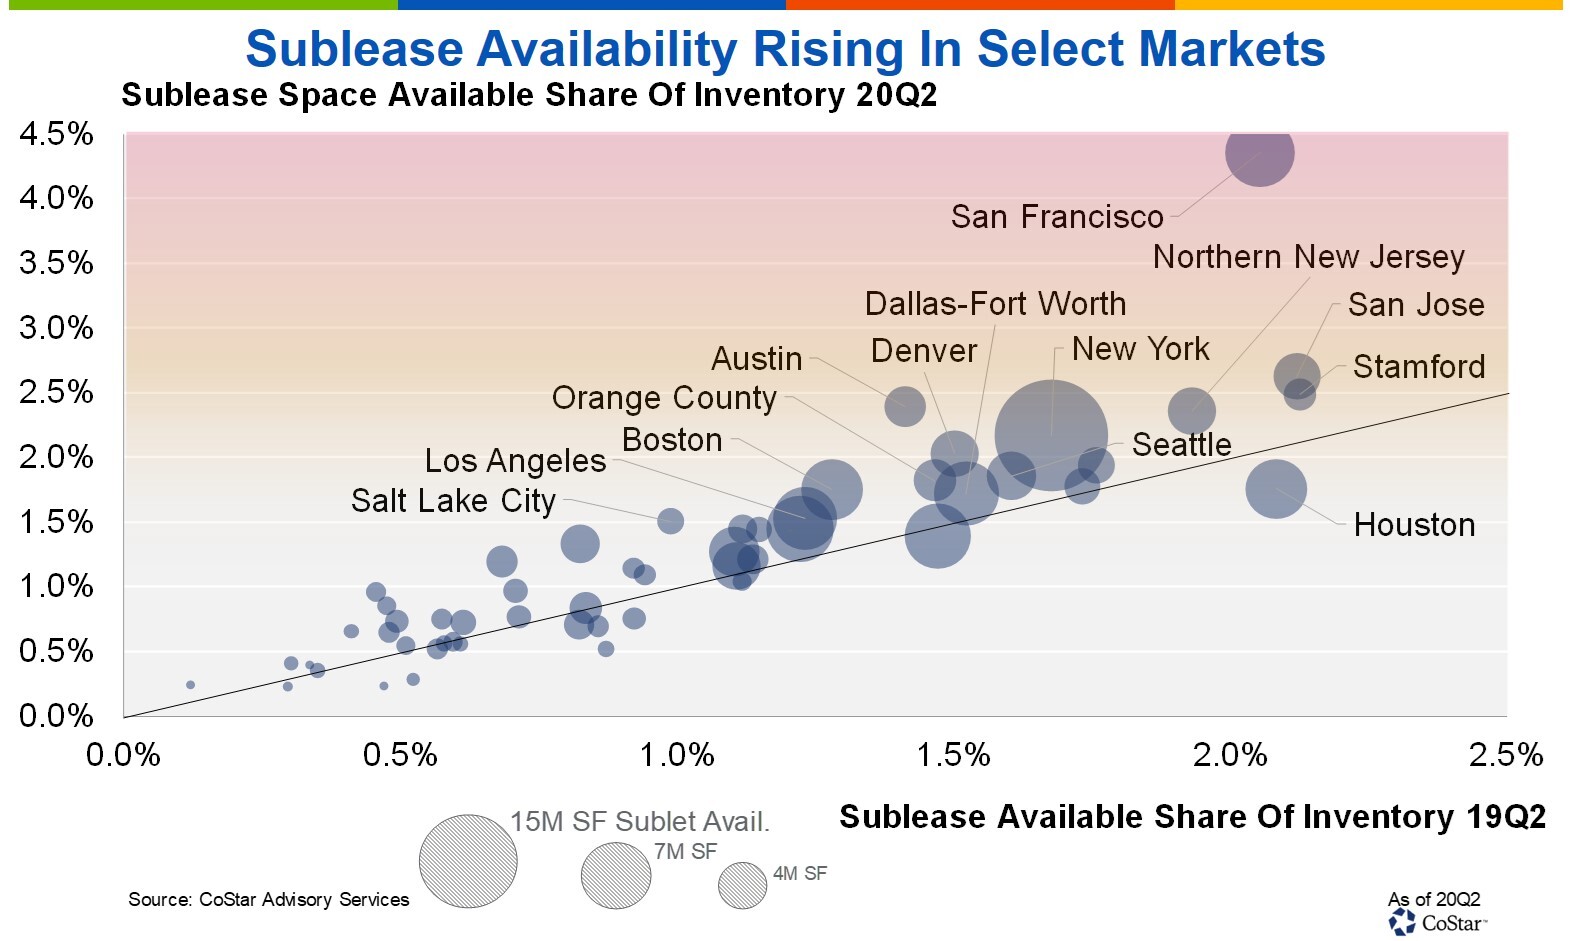
San Francisco stands out with sublease availability representing 4.4% of inventory, roughly doubling over the past year. Office sublease space is also on the rise in Austin and in San Jose, which have a higher preponderance of tech startups that are typically some of the first to cut back in a downturn. Most other markets currently have relatively low sublease availability overall but may pick up even more in the coming months. Sublease availability provides a good indication of where fundamentals may be weakening more than the headline vacancy rate suggests.
New office buildings that are just wrapping up will face headwinds in the near term. Lower preleasing rates, slower leasing velocity and rising competition from sublease space will combine to put pressure on office occupancy levels.
This is expected to be particularly acute in the downtown areas of gateway markets but may also be the case in some of the high-growth secondary markets that have been leaders in office demand growth in the last cycle.
However, regardless of market, office space that is being built today is probably better positioned to maintain occupancy in the long term. High-quality, modern space has been strongly preferred by tenants over the course of the past decade and may arguably be even more attractive going forward, as buildings that can provide the latest health and safety features will probably be preferred. Lower-quality space in office markets with significant construction availability remains at greater risk over the long term.
Nancy Muscatello is a managing consultant with CoStar Advisory Services in Boston.